Live FX

通貨を検索

340以上の通貨、暗号資産、貴金属から探せます

米ドル to オランダ領アンティル ギルダー (USDからANG)

1 USD = 1.7971 ANG 0.18%

1 ANG = 0.556442 USD · レートは2026年11月15日時点

換算先
1.7971

1 USD = 1.7971 ANG · 1 ANG = 0.556442 USD

USD/ANGのチャート

7日 0.07% 30日 0.27%
価格
ANG

米ドルをオランダ領アンティル ギルダーに換算

USDANG
1 USD 1.7971 ANG
5 USD 8.9857 ANG
10 USD 17.9713 ANG
25 USD 44.9283 ANG
50 USD 89.8567 ANG
100 USD 179.7133 ANG
500 USD 898.5665 ANG
1,000 USD 1,797.13 ANG
5,000 USD 8,985.67 ANG
10,000 USD 17,971.33 ANG

オランダ領アンティル ギルダーを米ドルに換算

ANGUSD
1 ANG 0.556442 USD
5 ANG 2.7822 USD
10 ANG 5.5644 USD
50 ANG 27.8221 USD
100 ANG 55.6442 USD
500 ANG 278.2209 USD
1,000 ANG 556.4418 USD
10,000 ANG 5,564.42 USD

今日のUSDからANG

ANGでの1 USD
1.7971 ANG
USDでの1 ANG
0.556442 USD
ANGでの100 USD
179.7133 ANG
24時間の変動
-0.18%
30日間の変動
-0.27%
1年間の変動
-0.14%
52週の値幅
1.7864 – 1.8212 ANG
レートの基準日
2026年11月15日

出典:オープンな currency-api データセット(fawazahmed0/exchange-api)。中央銀行と市場の情報をもとに毎日集計。仲値の参考レートで、情報提供のみを目的としています。

米ドル
USDの価格、チャート、統計
›
オランダ領アンティル ギルダー
ANGの価格、チャート、統計
›

関連する換算

USDからANGのよくある質問

今日、1 USDはANGでいくらですか?

2026年11月15日時点で、1 米ドル(USD)=1.7971 オランダ領アンティル ギルダー(ANG)です。したがって100 USDは179.7133 ANG、1,000 USDは1,797.13 ANGです。

今日、1 ANGはUSDでいくらですか?

1 オランダ領アンティル ギルダー(ANG)=0.556442 米ドル(USD)です。100 ANGは55.6442 USDです。

USDからANGのレートは上がっていますか、下がっていますか?

USD/ANGは、過去30日間で0.27%下落、過去7日間では0.07%下落です。 過去1年間は1.7864から1.8212ANGの間で取引されてきました(日次終値)、全体としては0.14%下落。

USD/ANGのレートはどこから来ていますか?

Live FX はUSD/ANGをオープンな currency-api データセット(fawazahmed0/exchange-api)。中央銀行と市場の情報をもとに毎日集計からのクロスレートとして計算しています、新しい日次の表は毎日公表されています。仲値の参考レートで、銀行やカード会社は通常0.5〜5%の上乗せをします。

関連ニュース

Action Forex··外国為替

EUR/USD Weekly Outlook

EUR/USD’s down trend resumed by braking through 1.1103 last week. Initial bias stays on the downside this week for 1.0904 fibonacci level. On the upside, above 1.1072 minor resistance will turn bias neutral and bring consolidations. But outlook will stay bearish as long as 1.1272 resistance holds, in case of recovery.
Action Forex··外国為替

USD/JPY Weekly Outlook

USD/JPY’s rise from from 152.87 resumed by breaking through 159.02 last week, but lost momentum ahead of 160.38 key structural resistance. Initial bias is turned neutral this week first. On the upside, firm break of 160.38 will target 100% projection of 152.87 to 159.02 from 156.06 at 162.21. However, break of 157.65 w

Action Forex··外国為替

GBP/USD Weekly Outlook

GBP/USD’s extended fall and break of 1.3271 support last week indicates that rebound from 1.3135 has completed at 1.3502 already Initial bias stays on the downside this week for 1.3135 first. Firm break there will target 1.3008 key support. On the upside, above 1.3282 minor resistance will turn intraday bias neutral. I

Action Forex··外国為替

USD/CHF Weekly Outlook

USD/CHF’s extended rebound last week confirms that correction from 0.8394 has completed at 0.8125 already. Initial bias remains on the upside this week. Decisive break of 0.8394 will resume whole rally from 0.7603 and target 0.8590 fibonacci level, which is close to 100% projection of 0.7948 to 0.8394 from 0.8125. On t

Action Forex··外国為替

AUD/USD Weekly Report

AUD/USD’s decline from 0.7237 continued last week. Initial bias stays on the downside this week for 0.6756 fibonacci level. Firm break there will target 100% projection of 0.7237 to 0.6893 from 0.7067 at 0.6723. On the upside, above 0.6853 minor resistance will turn intraday bias neutral first. In the bigger picture, p

Action Forex··外国為替

USD/CAD Weekly Outlook

USD/CAD’s rise from 1.3928 continued last week but lost momentum ahead of 1.4298 resistance. Initial bias remains neutral this week first On the upside, decisive break above 1.4298 high will resume the rally from 1.3480. Next target is 100% projection of 1.3730 to 1.4298 from 1.3928 at 1.4496. On the downside, below 1.

USDからANGを iPhone で

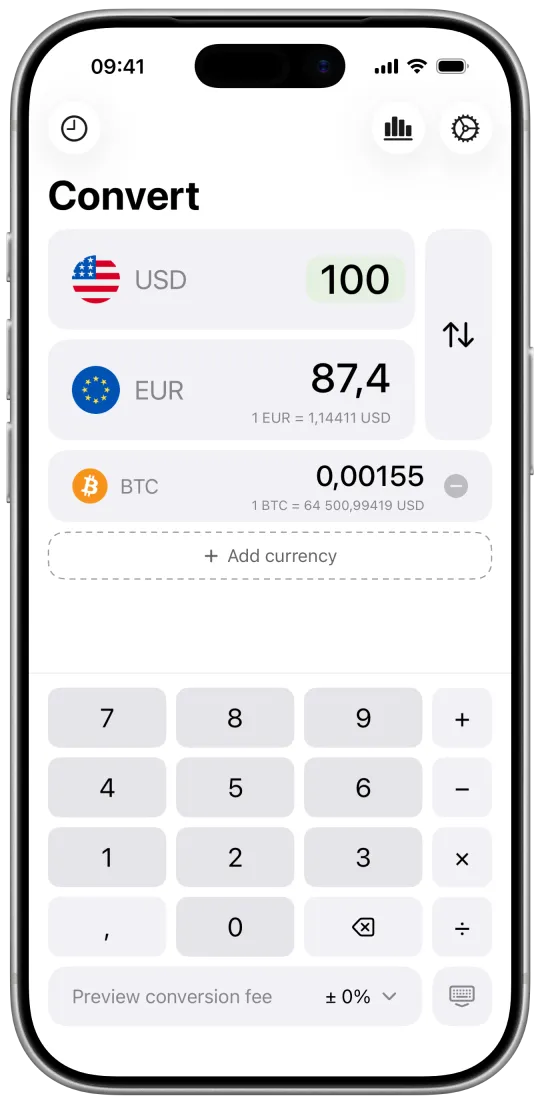
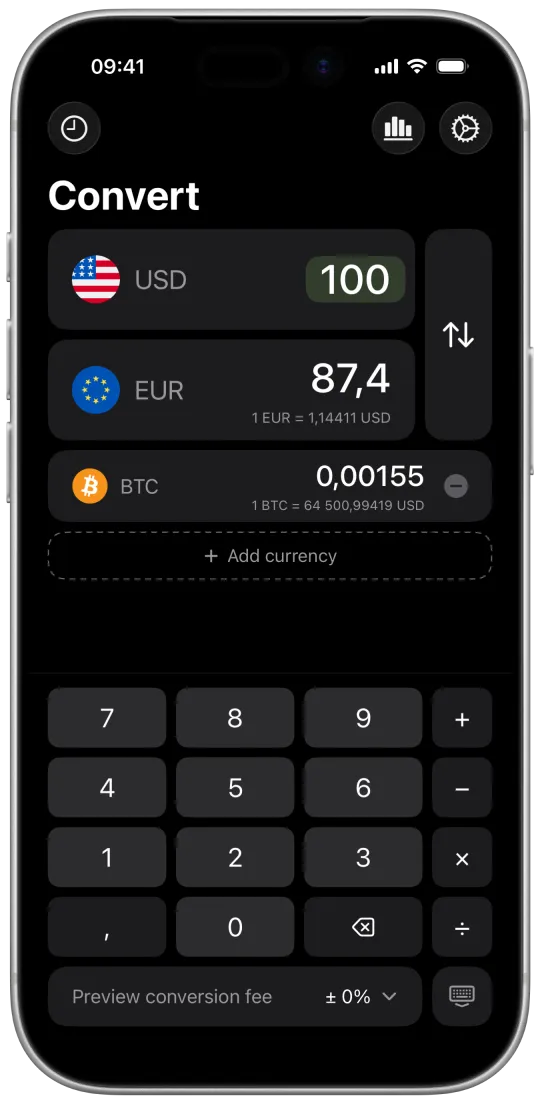
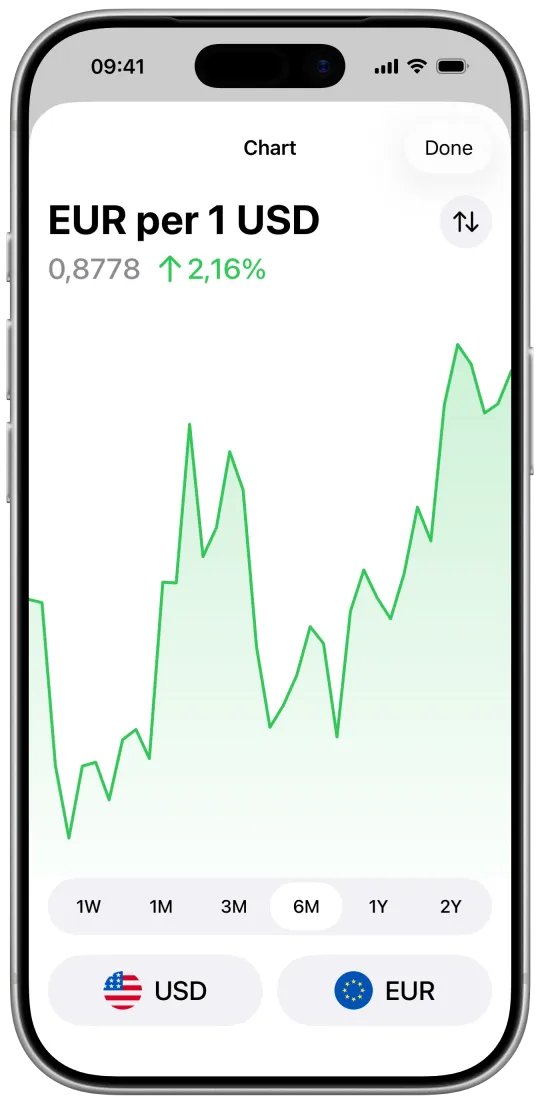
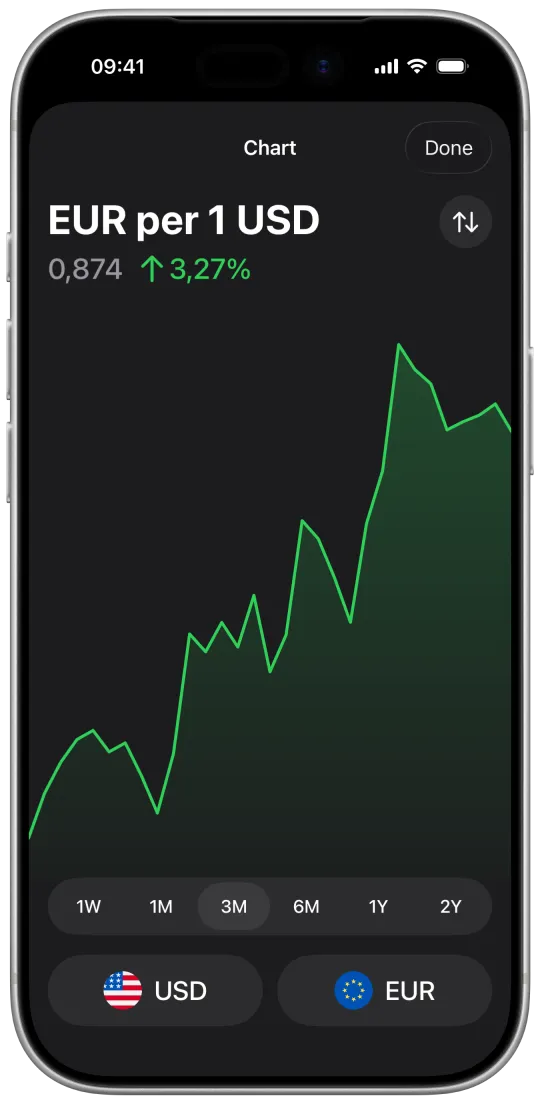
Live FX の iPhone アプリは、340以上の通貨、暗号資産、金を1タップで換算します。チャート、ホーム画面のウィジェット、カスタムレートにも対応。接続がなくても、最後に取得したレートで使えます。