جنيه إسترليني to سوموني طاجيكستاني (GBP إلى TJS)
1 GBP = 12.1718 TJS 0.006%
1 TJS = 0.082157 GBP · الأسعار حتى 16 نوفمبر 2026
1 GBP = 12.1718 TJS · 1 TJS = 0.082157 GBP
الرسم البياني لـ GBP/TJS
حوّل جنيه إسترليني إلى سوموني طاجيكستاني
| GBP | TJS |
|---|---|
| 1 GBP | 12.1718 TJS |
| 5 GBP | 60.8591 TJS |
| 10 GBP | 121.7182 TJS |
| 25 GBP | 304.2956 TJS |
| 50 GBP | 608.5912 TJS |
| 100 GBP | 1,217.18 TJS |
| 500 GBP | 6,085.91 TJS |
| 1,000 GBP | 12,171.82 TJS |
| 5,000 GBP | 60,859.12 TJS |
| 10,000 GBP | 121,718.25 TJS |
حوّل سوموني طاجيكستاني إلى جنيه إسترليني
| TJS | GBP |
|---|---|
| 1 TJS | 0.082157 GBP |
| 5 TJS | 0.410785 GBP |
| 10 TJS | 0.82157 GBP |
| 50 TJS | 4.1078 GBP |
| 100 TJS | 8.2157 GBP |
| 500 TJS | 41.0785 GBP |
| 1,000 TJS | 82.157 GBP |
| 10,000 TJS | 821.5695 GBP |
GBP إلى TJS اليوم
- 1 GBP بعملة TJS
- 12.1718 TJS
- 1 TJS بعملة GBP
- 0.082157 GBP
- 100 GBP بعملة TJS
- 1,217.18 TJS
- التغير خلال 24 ساعة
- +0.006%
- التغير خلال 30 يومًا
- -0.90%
- التغير خلال سنة
- +0.20%
- نطاق 52 أسبوعًا
- 12.043 – 12.912 TJS
- السعر حتى
- 16 نوفمبر 2026
المصدر: مجموعة بيانات currency-api المفتوحة (fawazahmed0/exchange-api)، وتُجمّع يوميًا من مصادر البنوك المركزية والأسواق. سعر مرجعي من منتصف السوق، للاطلاع فقط.
تحويلات ذات صلة
الأسئلة الشائعة حول GBP إلى TJS
كم يساوي 1 GBP بعملة TJS اليوم؟
حتى 16 نوفمبر 2026، يكون 1 جنيه إسترليني (GBP) = 12.1718 سوموني طاجيكستاني (TJS)، أي أن 100 GBP = 1,217.18 TJS و1,000 GBP = 12,171.82 TJS.
كم يساوي 1 TJS بعملة GBP؟
1 سوموني طاجيكستاني (TJS) = 0.082157 جنيه إسترليني (GBP)؛ و100 TJS = 8.2157 GBP.
هل يرتفع سعر GBP مقابل TJS أم ينخفض؟
GBP/TJS انخفاض 0.90% خلال آخر 30 يومًا وانخفاض 1.12% خلال 7 أيام. خلال العام الماضي تداول بين 12.043 و12.912 TJS (إغلاقات يومية)، وارتفاع 0.20% بشكل عام.
من أين يأتي سعر GBP/TJS؟
يحسب Live FX سعر GBP/TJS كسعر تقاطعي من مجموعة بيانات currency-api المفتوحة (fawazahmed0/exchange-api)، وتُجمّع يوميًا من مصادر البنوك المركزية والأسواق؛ يُنشر جدول يومي جديد كل يوم. وهو سعر مرجعي من منتصف السوق، إذ تضيف البنوك ومزوّدو البطاقات عادةً هامشًا يتراوح بين 0.5% و5%.
أخبار ذات صلة

FX option expiries for 17 November 10am New York cut
EUR/USD 1.1080 (EUR 1.93 bn) USD/JPY 160.00 (US$ 1.06 bn) 157.50 (US$ 1.81 bn) GBP/USD 1.3170 (GBP 1.59 bn) 1.3015 (GBP 1.28 bn) USD/CHF 0.8200 (US$ 761.58 mn) USD/CAD 1.4150 (US$ 330.00 mn) AUD/USD 0.6800 (AUD 593.00 mn) NZD/USD 0.5400 (NZD 1.62 bn) EUR/GBP 0.8475 (EUR 407.07 mn) 0.8400 (EUR 300.00 mn) 0.8325 (EUR 400

Gold Loses Its Footing with More Selling Pressure Looming
Key Highlights Gold failed to recover and declined below the $4,000 support. A few key hurdles seem to be forming near $3,950 and $3,990 on the 4-hour chart. WTI Crude Oil could struggle to surpass the $95.00 resistance. GBP/USD moved lower and traded below the 1.3250 support. Gold Price Technical Analysis Gold attempt

GBP/USD Daily Outlook
Intraday bias in GBP/USD remains on the downside for retesting 1.3135 low. Firm break there will target 1.3008 key support. On the upside, above 1.3282 minor resistance will turn intraday bias neutral. In the bigger picture, price actions from 1.3867 are a corrective pattern within the broader up trend from 1.0351 (202
GBP/JPY Daily Outlook
Intraday bias in GBP/JPY stays neutral first. On the upside, break of 213.75 will resume the rebound from 206.85, and target 217.45 resistance. However, firm break of 209.54 support will indicate that the rebound has completed, and bring retest of 206.85 low. In the bigger picture, price action from 219.56 is seen as c
EUR/GBP Daily Outlook
Intraday bias in EUR/GBP remains neutral as consolidations continue above 0.8320. Further decline is expected as long as 0.8401 resistance holds. On the downside, firm break of 0.8320 will extend larger down trend to 138.2% projection of 0.8728 to 0.8453 from 0.8611 at at 0.8231. In the bigger picture, rise from 0.8221
GBP إلى TJS على جهاز iPhone الخاص بك
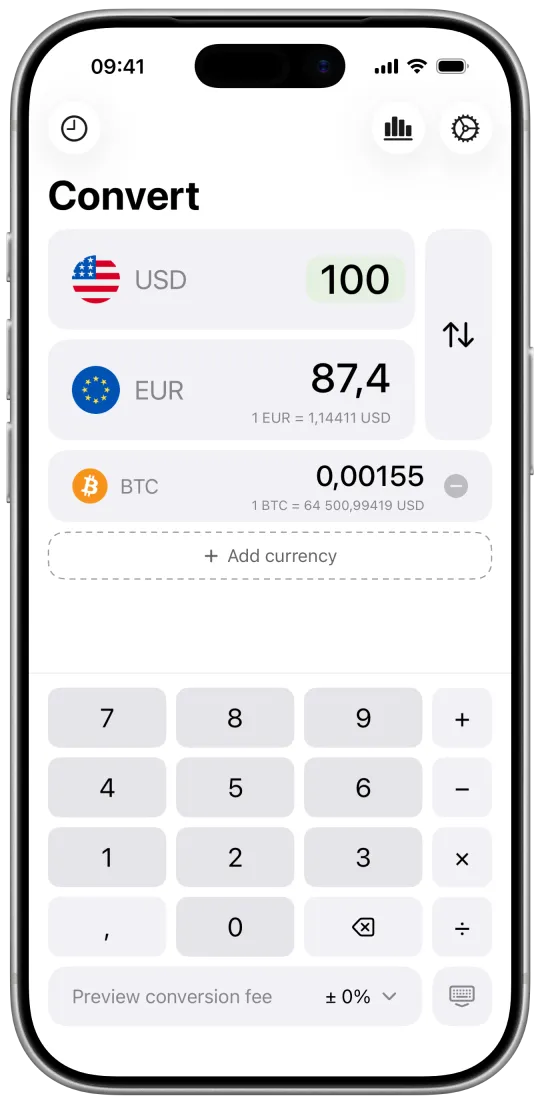
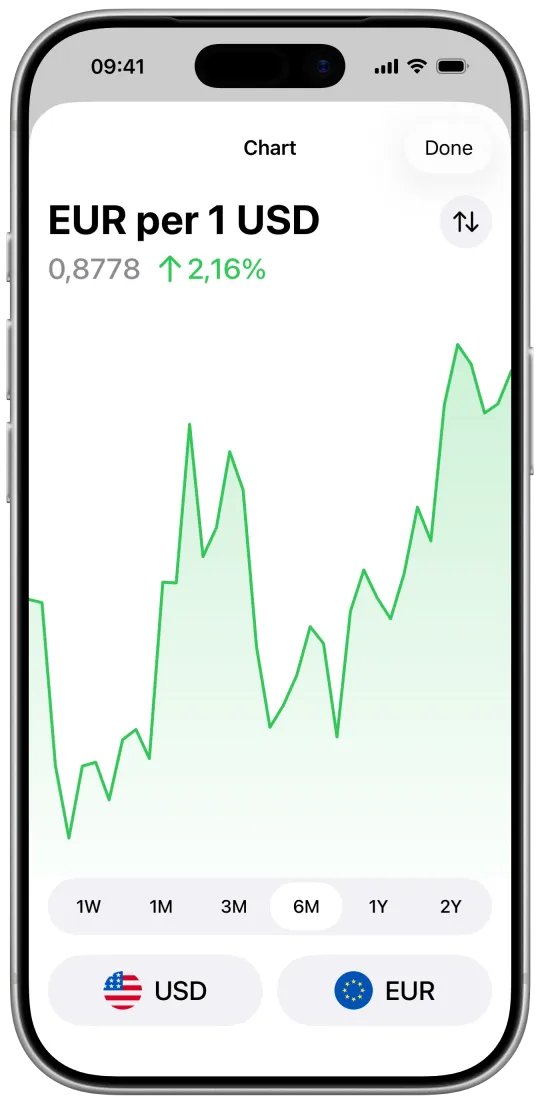
يحوّل Live FX لجهاز iPhone أكثر من 340 عملة والعملات المشفّرة والذهب بنقرة واحدة، مع رسوم بيانية وأدوات على الشاشة الرئيسية وأسعار مخصصة. يعمل دون اتصال باستخدام آخر الأسعار.