英国ポンド to タジキスタン ソモニ (GBPからTJS)
1 GBP = 12.1718 TJS 0.006%
1 TJS = 0.082157 GBP · レートは2026年11月16日時点
1 GBP = 12.1718 TJS · 1 TJS = 0.082157 GBP
GBP/TJSのチャート
英国ポンドをタジキスタン ソモニに換算
| GBP | TJS |
|---|---|
| 1 GBP | 12.1718 TJS |
| 5 GBP | 60.8591 TJS |
| 10 GBP | 121.7182 TJS |
| 25 GBP | 304.2956 TJS |
| 50 GBP | 608.5912 TJS |
| 100 GBP | 1,217.18 TJS |
| 500 GBP | 6,085.91 TJS |
| 1,000 GBP | 12,171.82 TJS |
| 5,000 GBP | 60,859.12 TJS |
| 10,000 GBP | 121,718.25 TJS |
タジキスタン ソモニを英国ポンドに換算
| TJS | GBP |
|---|---|
| 1 TJS | 0.082157 GBP |
| 5 TJS | 0.410785 GBP |
| 10 TJS | 0.82157 GBP |
| 50 TJS | 4.1078 GBP |
| 100 TJS | 8.2157 GBP |
| 500 TJS | 41.0785 GBP |
| 1,000 TJS | 82.157 GBP |
| 10,000 TJS | 821.5695 GBP |
今日のGBPからTJS
- TJSでの1 GBP
- 12.1718 TJS
- GBPでの1 TJS
- 0.082157 GBP
- TJSでの100 GBP
- 1,217.18 TJS
- 24時間の変動
- +0.006%
- 30日間の変動
- -0.90%
- 1年間の変動
- +0.20%
- 52週の値幅
- 12.043 – 12.912 TJS
- レートの基準日
- 2026年11月16日
出典:オープンな currency-api データセット(fawazahmed0/exchange-api)。中央銀行と市場の情報をもとに毎日集計。仲値の参考レートで、情報提供のみを目的としています。
関連する換算
GBPからTJSのよくある質問
今日、1 GBPはTJSでいくらですか?
2026年11月16日時点で、1 英国ポンド(GBP)=12.1718 タジキスタン ソモニ(TJS)です。したがって100 GBPは1,217.18 TJS、1,000 GBPは12,171.82 TJSです。
今日、1 TJSはGBPでいくらですか?
1 タジキスタン ソモニ(TJS)=0.082157 英国ポンド(GBP)です。100 TJSは8.2157 GBPです。
GBPからTJSのレートは上がっていますか、下がっていますか?
GBP/TJSは、過去30日間で0.90%下落、過去7日間では1.12%下落です。 過去1年間は12.043から12.912TJSの間で取引されてきました(日次終値)、全体としては0.20%上昇。
GBP/TJSのレートはどこから来ていますか?
Live FX はGBP/TJSをオープンな currency-api データセット(fawazahmed0/exchange-api)。中央銀行と市場の情報をもとに毎日集計からのクロスレートとして計算しています、新しい日次の表は毎日公表されています。仲値の参考レートで、銀行やカード会社は通常0.5〜5%の上乗せをします。
関連ニュース

FX option expiries for 17 November 10am New York cut
EUR/USD 1.1080 (EUR 1.93 bn) USD/JPY 160.00 (US$ 1.06 bn) 157.50 (US$ 1.81 bn) GBP/USD 1.3170 (GBP 1.59 bn) 1.3015 (GBP 1.28 bn) USD/CHF 0.8200 (US$ 761.58 mn) USD/CAD 1.4150 (US$ 330.00 mn) AUD/USD 0.6800 (AUD 593.00 mn) NZD/USD 0.5400 (NZD 1.62 bn) EUR/GBP 0.8475 (EUR 407.07 mn) 0.8400 (EUR 300.00 mn) 0.8325 (EUR 400

Gold Loses Its Footing with More Selling Pressure Looming
Key Highlights Gold failed to recover and declined below the $4,000 support. A few key hurdles seem to be forming near $3,950 and $3,990 on the 4-hour chart. WTI Crude Oil could struggle to surpass the $95.00 resistance. GBP/USD moved lower and traded below the 1.3250 support. Gold Price Technical Analysis Gold attempt

GBP/USD Daily Outlook
Intraday bias in GBP/USD remains on the downside for retesting 1.3135 low. Firm break there will target 1.3008 key support. On the upside, above 1.3282 minor resistance will turn intraday bias neutral. In the bigger picture, price actions from 1.3867 are a corrective pattern within the broader up trend from 1.0351 (202
GBP/JPY Daily Outlook
Intraday bias in GBP/JPY stays neutral first. On the upside, break of 213.75 will resume the rebound from 206.85, and target 217.45 resistance. However, firm break of 209.54 support will indicate that the rebound has completed, and bring retest of 206.85 low. In the bigger picture, price action from 219.56 is seen as c
EUR/GBP Daily Outlook
Intraday bias in EUR/GBP remains neutral as consolidations continue above 0.8320. Further decline is expected as long as 0.8401 resistance holds. On the downside, firm break of 0.8320 will extend larger down trend to 138.2% projection of 0.8728 to 0.8453 from 0.8611 at at 0.8231. In the bigger picture, rise from 0.8221
GBPからTJSを iPhone で
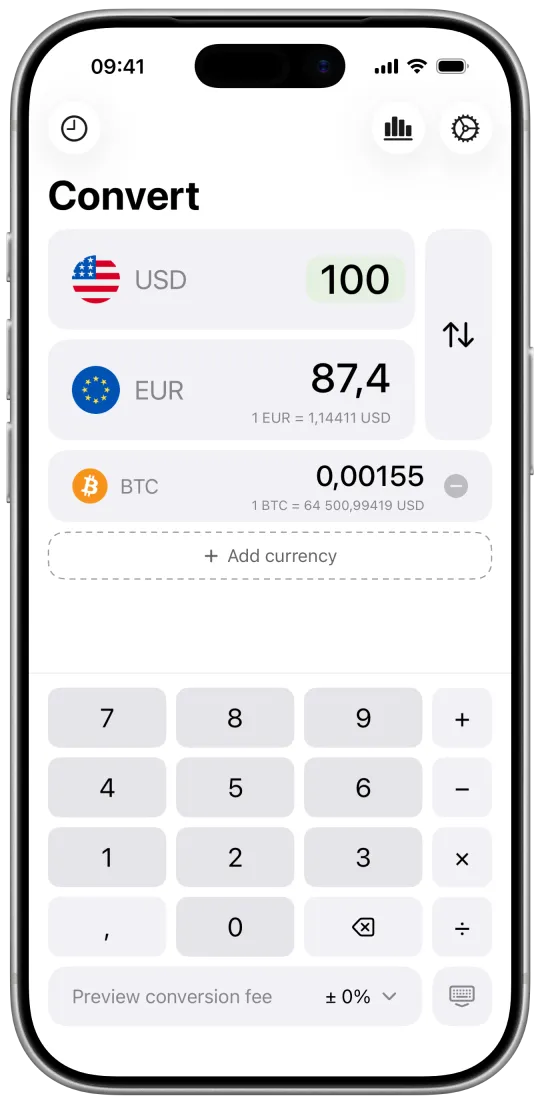
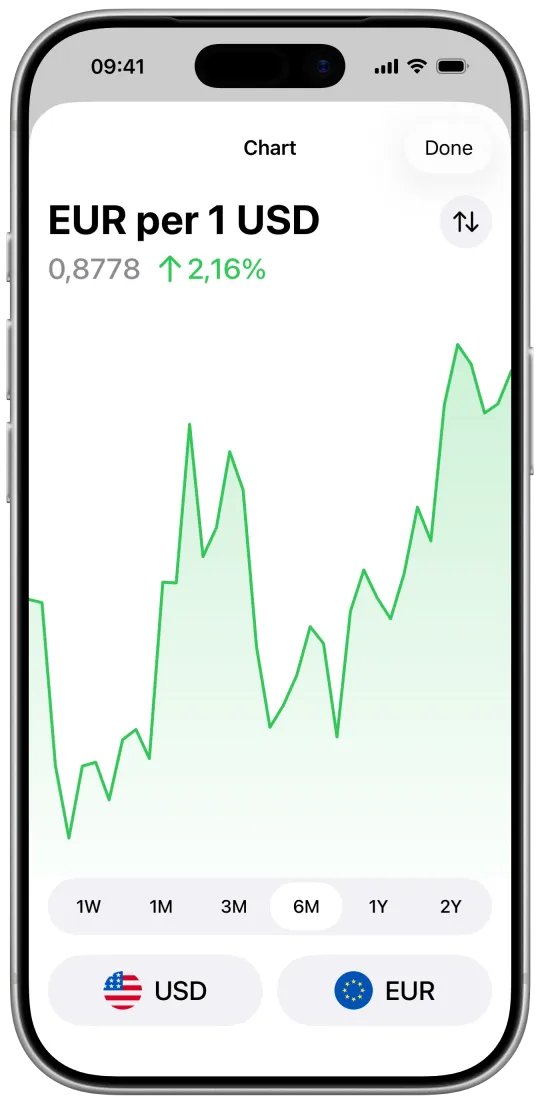
Live FX の iPhone アプリは、340以上の通貨、暗号資産、金を1タップで換算します。チャート、ホーム画面のウィジェット、カスタムレートにも対応。接続がなくても、最後に取得したレートで使えます。