British Pound to Omani Rial (GBP to OMR)
1 GBP = 0.508577 OMR 0.04%
1 OMR = 1.9663 GBP · rates as of November 16, 2026
1 GBP = 0.508577 OMR · 1 OMR = 1.9663 GBP
GBP/OMR chart
Convert British Pound to Omani Rial
| GBP | OMR |
|---|---|
| 1 GBP | 0.508577 OMR |
| 5 GBP | 2.5429 OMR |
| 10 GBP | 5.0858 OMR |
| 25 GBP | 12.7144 OMR |
| 50 GBP | 25.4289 OMR |
| 100 GBP | 50.8577 OMR |
| 500 GBP | 254.2887 OMR |
| 1,000 GBP | 508.5775 OMR |
| 5,000 GBP | 2,542.89 OMR |
| 10,000 GBP | 5,085.77 OMR |
Convert Omani Rial to British Pound
| OMR | GBP |
|---|---|
| 1 OMR | 1.9663 GBP |
| 5 OMR | 9.8313 GBP |
| 10 OMR | 19.6627 GBP |
| 50 OMR | 98.3134 GBP |
| 100 OMR | 196.6269 GBP |
| 500 OMR | 983.1344 GBP |
| 1,000 OMR | 1,966.27 GBP |
| 10,000 OMR | 19,662.69 GBP |
GBP to OMR today
- 1 GBP in OMR
- 0.508577 OMR
- 1 OMR in GBP
- 1.9663 GBP
- 100 GBP in OMR
- 50.8577 OMR
- 24h change
- -0.04%
- 30-day change
- -0.22%
- 1-year change
- +0.40%
- 52-week range
- 0.502153 – 0.5313 OMR
- Rate as of
- November 16, 2026
Source: the open currency-api dataset (fawazahmed0/exchange-api), compiled daily from central-bank and market sources. Mid-market reference rate, for information only.
Related conversions
GBP to OMR FAQ
How much is 1 GBP in OMR today?
As of November 16, 2026, 1 British Pound (GBP) = 0.508577 Omani Rial (OMR), so 100 GBP is 50.8577 OMR and 1,000 GBP is 508.5775 OMR.
How much is 1 OMR in GBP?
1 Omani Rial (OMR) = 1.9663 British Pound (GBP); 100 OMR is 196.6269 GBP.
Is the GBP to OMR rate going up or down?
GBP/OMR is down 0.22% over the last 30 days and down 1.15% over 7 days. Over the past year it has traded between 0.502153 and 0.5313 OMR (daily closes), up 0.40% overall.
Where does the GBP/OMR rate come from?
Live FX calculates GBP/OMR as a cross rate from the open currency-api dataset (fawazahmed0/exchange-api), compiled daily from central-bank and market sources; a new daily table is published every day. It is a mid-market reference rate; banks and card providers usually add a 0.5–5% markup.
Related news

FX option expiries for 17 November 10am New York cut
EUR/USD 1.1080 (EUR 1.93 bn) USD/JPY 160.00 (US$ 1.06 bn) 157.50 (US$ 1.81 bn) GBP/USD 1.3170 (GBP 1.59 bn) 1.3015 (GBP 1.28 bn) USD/CHF 0.8200 (US$ 761.58 mn) USD/CAD 1.4150 (US$ 330.00 mn) AUD/USD 0.6800 (AUD 593.00 mn) NZD/USD 0.5400 (NZD 1.62 bn) EUR/GBP 0.8475 (EUR 407.07 mn) 0.8400 (EUR 300.00 mn) 0.8325 (EUR 400

Gold Loses Its Footing with More Selling Pressure Looming
Key Highlights Gold failed to recover and declined below the $4,000 support. A few key hurdles seem to be forming near $3,950 and $3,990 on the 4-hour chart. WTI Crude Oil could struggle to surpass the $95.00 resistance. GBP/USD moved lower and traded below the 1.3250 support. Gold Price Technical Analysis Gold attempt

GBP/USD Daily Outlook
Intraday bias in GBP/USD remains on the downside for retesting 1.3135 low. Firm break there will target 1.3008 key support. On the upside, above 1.3282 minor resistance will turn intraday bias neutral. In the bigger picture, price actions from 1.3867 are a corrective pattern within the broader up trend from 1.0351 (202
GBP/JPY Daily Outlook
Intraday bias in GBP/JPY stays neutral first. On the upside, break of 213.75 will resume the rebound from 206.85, and target 217.45 resistance. However, firm break of 209.54 support will indicate that the rebound has completed, and bring retest of 206.85 low. In the bigger picture, price action from 219.56 is seen as c
EUR/GBP Daily Outlook
Intraday bias in EUR/GBP remains neutral as consolidations continue above 0.8320. Further decline is expected as long as 0.8401 resistance holds. On the downside, firm break of 0.8320 will extend larger down trend to 138.2% projection of 0.8728 to 0.8453 from 0.8611 at at 0.8231. In the bigger picture, rise from 0.8221
GBP to OMR on your iPhone
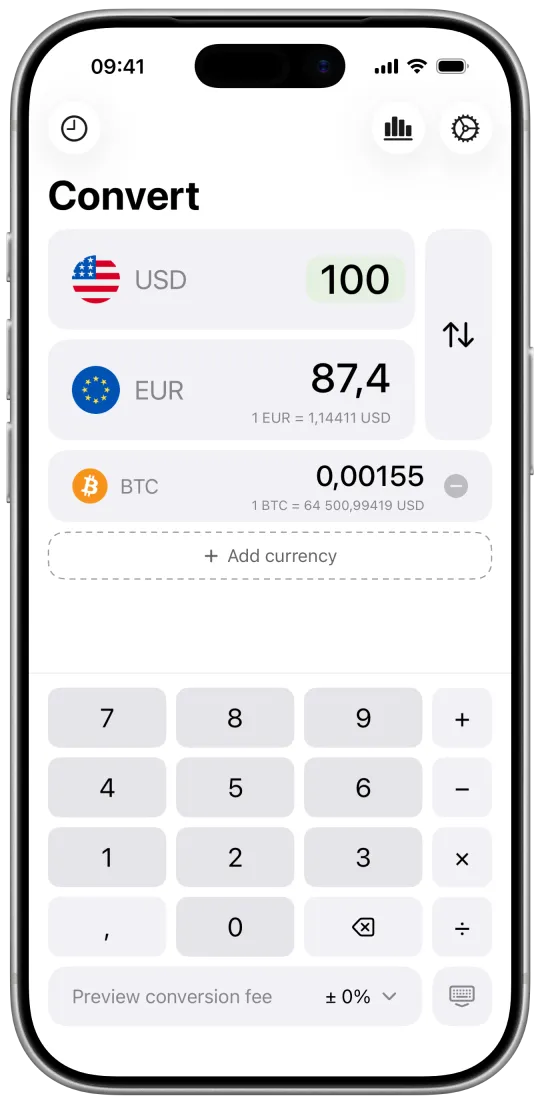
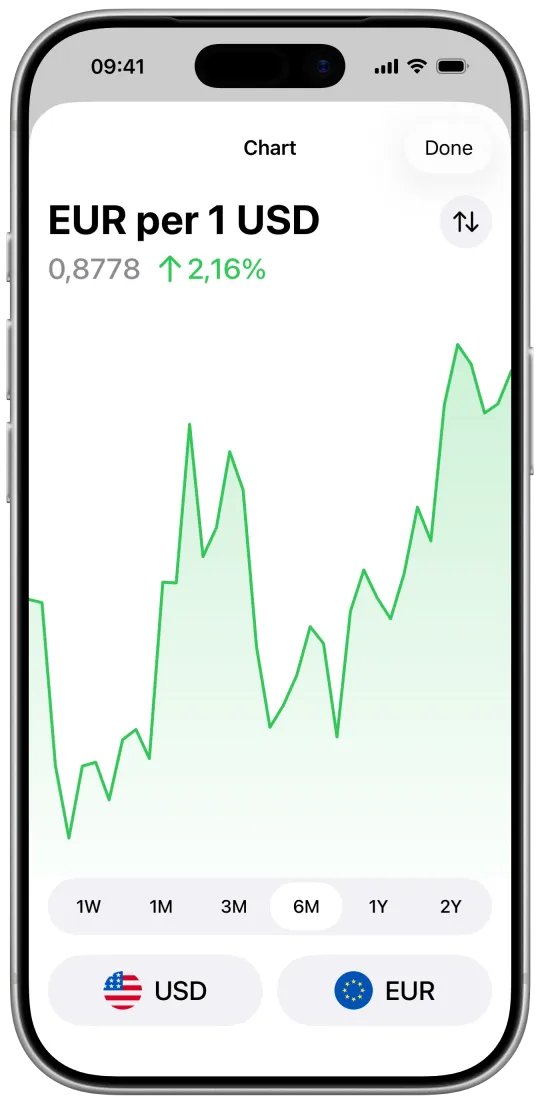
Live FX for iPhone converts 340+ currencies, crypto and gold in one tap, with charts, home-screen widgets and custom rates. Works without a connection using the last rates.