How Exchange Rates Work: Mid-Market Rate, Spreads and What Moves Them
What an exchange rate actually is, why your bank's rate differs from Google's, how to calculate the hidden markup yourself, and what makes currencies move.
 Live FX Editorial Team · · 6 min read
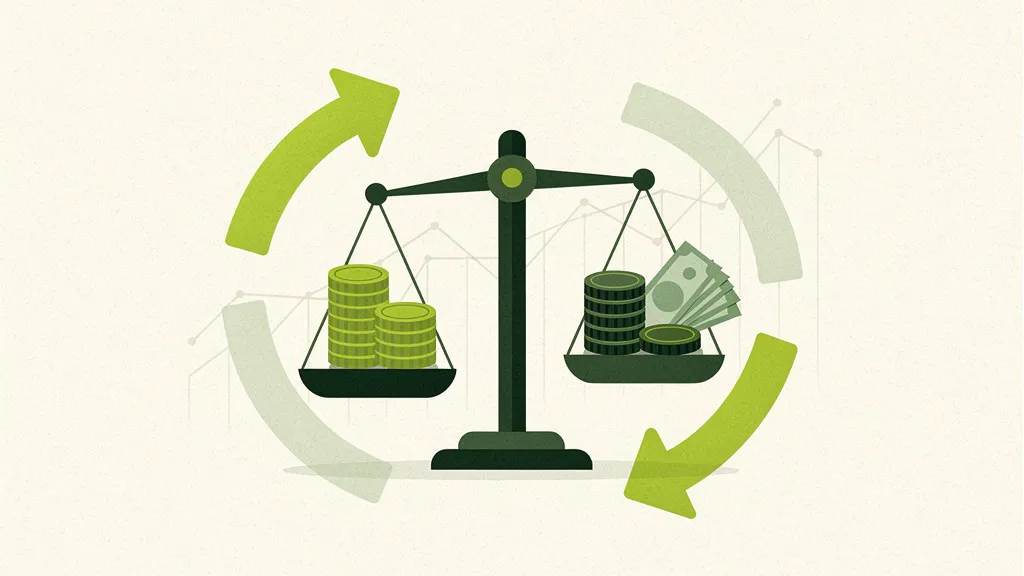
An exchange rate is the price of one currency in another, set continuously by supply and demand in the global currency market. The rate you see on Google or Live FX is the mid-market rate, halfway between the buy and sell prices, while banks, exchange offices and card schemes add a spread or fee on top, which you can measure as (their rate − mid-market) ÷ mid-market.
On this page
Every time you pay abroad, send money home or check a price in another currency, you are using an exchange rate. Most people only notice it when the number on their bank statement is worse than the number they looked up. This guide explains where exchange rates come from, why there is never just one rate, and how to work out exactly what a bank or exchange office is charging you.
Rates in the examples are mid-market rates from Live FX as of November 12, 2026. For the current numbers use the currency converter.
What an exchange rate is
An exchange rate is simply the price of one currency expressed in another. When you see:
EUR/USD = 1.1077
it means one euro costs 1.1077 US dollars. The first currency (EUR) is the base currency; the second (USD) is the quote currency, the one the price is written in.
Turn it around and you get the inverse rate: 1 ÷ 1.1077 = 0.9028, so one US dollar buys 0.9028 euros (USD to EUR). Both numbers describe the same price.
You can also chain rates to get a cross rate between two currencies that are usually quoted against the dollar:
- USD/JPY = 159.86 and EUR/USD = 1.1077
- EUR/JPY = 159.86 × 1.1077 = 177.08 yen per euro
Where the price comes from
Most major currencies (the dollar, euro, pound, yen, Swiss franc, Australian and Canadian dollars) float. There is no official price; the rate is whatever buyers and sellers agree on in the foreign-exchange (FX) market, the largest financial market in the world. The Bank for International Settlements’ latest triennial survey measured average turnover of about $9.6 trillion a day in April 2025 (up from $7.5 trillion in 2022), and the US dollar was on one side of 89% of all trades.
That market is mostly banks, payment companies, exporters and importers, investment funds and central banks trading with each other electronically, around the clock from Monday morning in Sydney to Friday evening in New York.
Not every currency floats freely. Under the IMF’s classification, some countries peg their currency to another one or to a basket, and their central bank intervenes to hold the rate:
| Regime | How the rate is set | Examples |
|---|---|---|
| Free float | Market supply and demand | US dollar, euro, yen, pound |
| Managed float | Market, with central-bank intervention to smooth moves | Many emerging-market currencies |
| Conventional peg | Held at a fixed level against one currency or basket | Saudi riyal, UAE dirham, Bahraini dinar (USD); Danish krone (EUR, within a narrow band) |
| No separate currency | Uses another country’s money | Ecuador and Panama (USD), Montenegro (EUR) |
Mid-market, buy and sell: why there is never one rate
At any moment, a dealer quotes two prices:
- Bid: the price at which they will buy the base currency from you
- Ask (or offer): the price at which they will sell it to you
The gap between them is the spread, and it is how currency dealers make money. The mid-market rate is exactly halfway between the two. It is the rate you see on Live FX currency pages, Google and XE, and the only rate with no markup built in.
Between big banks the spread on EUR/USD is a tiny fraction of a cent. For consumers it is much wider, because retail providers add their margin:
| Where you exchange | Typical cost vs mid-market |
|---|---|
| Wholesale interbank market | A tiny fraction of 1% |
| Card network rate (Visa, Mastercard) | Close to mid-market, plus any foreign transaction fee your bank charges |
| Bank branch or ordering currency from your bank | Commonly a few percent |
| Airport and tourist-area kiosks | Often the widest spreads |
Those are typical patterns, not guarantees, which is why it pays to measure the markup yourself.
How to calculate the markup you are being charged
You only need two numbers taken at the same moment: the rate you are offered, and the mid-market rate (from the converter).
Markup % = (offered price − mid-market price) ÷ mid-market price × 100
Write both rates as the price of the currency you are buying.
Example 1: buying euros with dollars. The mid-market rate is $1.1077 per euro. A bank sells you euros at $1.1520 each.
(1.1520 − 1.1077) ÷ 1.1077 = 0.040 → 4.0% markup. On €500 that is about $22 more than the mid-market cost.
Example 2: the sign shows “1 USD = 0.87 EUR”. Here you are buying euros and the board quotes how many euros you get per dollar, so convert it to a price per euro first: 1 ÷ 0.87 = $1.1494 per euro.
(1.1494 − 1.1077) ÷ 1.1077 = 0.038 → 3.8% markup.
Tip: “0% commission” or “no fee” does not mean free. If the rate is worse than mid-market, the fee is built into the rate. Always compare the amount you will actually receive.
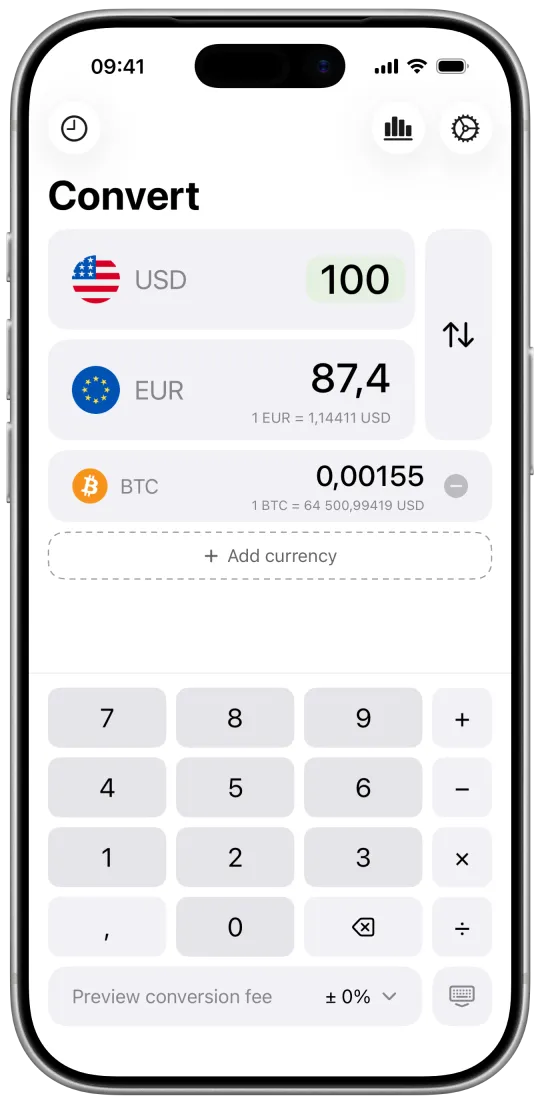
The Live FX iPhone app does this arithmetic for you: its conversion-fee preview applies a typical ATM (±2%), card (±3%) or kiosk (±5%) markup (or your own percentage), so you see what a quote really costs before you accept it.
What makes exchange rates move
Over days and months, currencies respond to anything that changes how much people want to hold them:
- Interest rates. Higher rates (or expected rate hikes) from a central bank tend to attract capital and strengthen the currency. That is why central-bank meetings move markets; follow them in our central-bank news.
- Inflation. Over the long run, currencies with persistently higher inflation tend to lose value against those with lower inflation (the idea behind purchasing power parity).
- Growth and trade. A strong economy and rising exports increase demand for a country’s currency. Commodity exporters’ currencies (Canadian dollar, Norwegian krone, Australian dollar) often follow oil and metal prices.
- Risk sentiment. In a crisis, investors tend to buy “safe-haven” currencies such as the US dollar, Swiss franc and Japanese yen.
- Politics and policy. Elections, tariffs, sanctions and government debt can all shift expectations quickly.
- Central-bank intervention, especially for pegged or managed currencies.
Short-term moves are mostly noise; nobody predicts them reliably. For travel money, it is usually smarter to cut the fees you pay than to try to time the rate.
Daily reference rates vs live rates
You will often see two kinds of “official” rate:
- Live (streaming) rates: the market price right now. Live FX shows live prices for crypto and a daily snapshot for fiat currencies and metals.
- Reference rates: a snapshot published once a day, used for accounting, contracts and statistics. The European Central Bank publishes its euro reference rates at around 16:00 Central European Time every working day and says they are for information purposes only: using them for transactions is “strongly discouraged”. The most widely used market benchmark, the WMR (formerly WM/Reuters) rate, is fixed at 4 p.m. London time from actual trades.
A reference rate can differ slightly from the live rate a few hours later, so for big transfers check the price at the moment you trade.
Quick glossary
- Base / quote currency: in EUR/USD, EUR is the base and USD the quote.
- Mid-market rate: midpoint between bid and ask; no markup.
- Spread: the gap between the buy and sell price.
- Cross rate: a rate between two non-dollar currencies, derived via the dollar.
- Peg: a currency fixed to another one by its central bank.
- Dynamic currency conversion: when a shop or ATM converts your purchase into your home currency for you, usually at a poor rate. See our guide to paying in local currency.
Frequently asked questions
What is the mid-market exchange rate?
The mid-market rate is the midpoint between the price at which banks buy and sell a currency on the wholesale market. It is the fairest reference rate, has no markup built in, and is what Google, XE and Live FX display. Consumers almost never get exactly this rate.
How do I calculate the markup on an exchange rate?
Compare the rate you are offered with the mid-market rate at the same moment: markup % = (offered price − mid-market price) ÷ mid-market price × 100, with both rates written as the price of the currency you are buying. For example, paying $1.1520 per euro when the mid-market is $1.1077 is a 4.0% markup.
Why is my bank's exchange rate different from Google's?
Google shows the mid-market rate. Banks quote a 'sell' rate that includes their spread (their profit and risk margin), and may add a separate percentage fee. The difference is usually 1–5% at banks and more at airport kiosks.
Who sets exchange rates?
For most major currencies nobody sets them: they float, and the price comes from millions of trades between banks, companies, funds and central banks. Some countries fix or peg their currency to another (for example several Gulf currencies to the US dollar), and their central bank buys and sells to hold that level.
How often do exchange rates change?
Floating currencies change every second while markets are open: 24 hours a day from Monday morning in Asia to Friday evening in New York. Daily reference rates, such as the ECB's euro rates, are snapshots taken once a day.
Sources
- Bank for International Settlements: OTC foreign exchange turnover in April 2025 (Triennial Survey)
- LSEG / FTSE Russell: WMR FX benchmarks (4pm London fix)
- European Central Bank: Euro foreign exchange reference rates
- IMF: Annual Report on Exchange Arrangements and Exchange Restrictions (AREAER)
Rates quoted in this guide are mid-market reference rates from Live FX’s data (the open currency-api dataset for fiat and metals, CoinGecko for crypto) and are for information only. Fees change, so check your own bank’s current terms before you travel.
Rates in your pocket, even offline
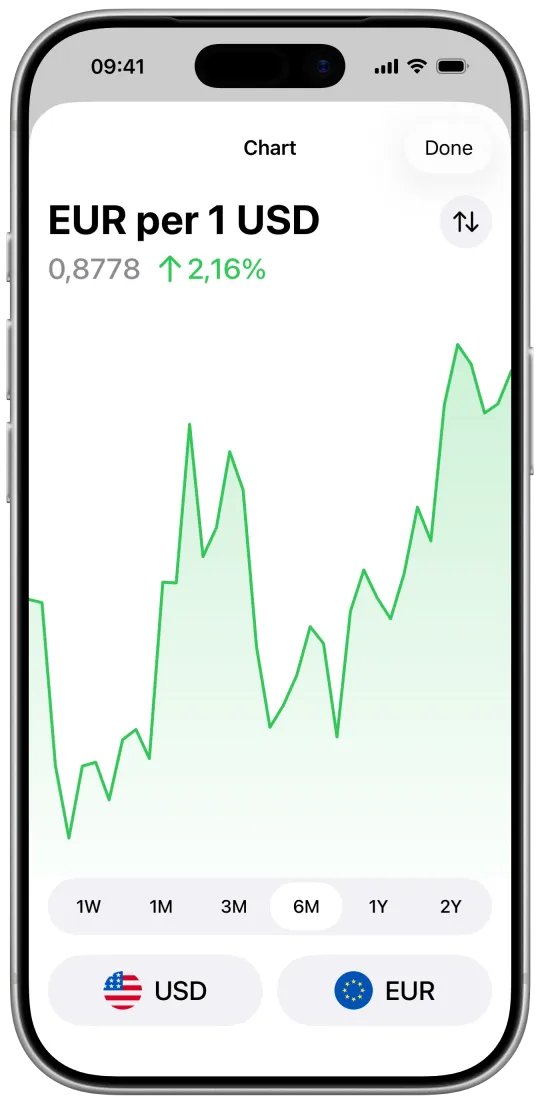
Live FX for iPhone converts 340+ currencies, crypto and gold in one tap, with charts, home-screen widgets and custom rates. Works without a connection using the last rates.